

Detailed Option Assessment
A robust appraisal of interventions and pathways, applying four principles: proportionality, transparency, traceability and whole-life value.
Two ground rules
Always compare against a baseline
Options should be compared against a clearly defined baseline or do-minimum case. An option's performance in isolation says nothing; its performance relative to doing the minimum is the decision-relevant number.
Always record residual risk
Residual risk should always be recorded, rather than assuming an intervention removes risk completely.
This is a discipline that appraisals routinely lose. An intervention reduces risk; it does not usually eliminate it, and the remainder has to stay visible.
Purpose
The process follows an option-engineering and risk-reduction logic. It starts from the risk profile produced by the risk assessment and develops feasible interventions using technical option libraries, engineering judgement, operational knowledge and stakeholder input.
The assessment should:
- Systematically evaluate option performance
- Explore trade-offs between environmental, social, economic, operational and resilience outcomes
- Support consensus-building among stakeholders and their priorities
- Provide an evidence-based justification for selecting a preferred option or shortlist
Sensitivity testing should be used where costs, benefits, deterioration rates, climate conditions, demand or delivery assumptions are uncertain. Options may also be retained as contingent or trigger-based measures rather than selected immediately.
Questions answered
- Which options are technically feasible for the affected asset, route or system?
- How does each option affect asset condition, service level, capacity, resilience, sustainability and whole-life performance?
- What are the expected costs, benefits, risk-reduction effects, implementation requirements and residual risks?
- What risk reduction is achieved? Estimated by recalculating how each option changes the probability of deterioration or failure, the associated consequences, the duration of disruption, and the resulting residual risk
- How can optioneering inform portfolio optimisation for prioritisation, scheduling and resource allocation?
Tools
The level of sophistication should reflect the scale of the decision and the quality of available data.
| Tool | What it does |
|---|---|
| Risk-reduction models | Quantify changes in likelihood, consequence and residual risk following intervention |
| Cost-estimation and whole-life-cost models | Capital cost, inspection, maintenance, operation, renewal and end-of-life costs |
| Cost-benefit analysis | Monetised benefits such as avoided damage, reduced disruption, improved safety, extended service life, avoided emergency expenditure |
| Multi-criteria analysis (MCA) | Compare options across sustainability, service level, technical performance, resilience, procurement, constructability, ease of maintenance and economic impact |
| GIS and network-analysis tools | Spatial constraints, affected users, diversion effects, connected assets, system interdependencies |
| Asset-interdependency models | How an intervention alters risks, costs or performance across linked assets |
| Adaptation-pathway tools | Decision trees, trigger frameworks and dynamic adaptive policy pathways, to sequence actions under future uncertainty |
The two stages
The process is undertaken iteratively. An initial assessment filters a long list into a manageable shortlist; as understanding improves and design detail increases, further rounds compare alternative variants of the shortlisted options.
| Stage | What it does |
|---|---|
| Stage 1 | Assess the filtered long list using MCA, screening against the baseline with proportionate criteria to reach a manageable shortlist |
| Stage 2 | Detailed appraisal of shortlisted options, and confirmation of the preferred option |
Where decisions concern multiple assets, routes or interventions, the preferred options are taken forward into Portfolio Optimisation.
Stage 1: Multi-Criteria Analysis
MCA provides a structured and transparent method for evaluating trade-offs across environmental, social, economic, operational and resilience objectives. Weighting and scoring are applied to understand the relative performance and robustness of options.
Keep the framework fixed between rounds
MCA may be applied through multiple rounds of optioneering, progressively narrowing the range of options.
The handbook is explicit that the assessment criteria, indicators and weightings remain unchanged between rounds, to ensure consistency and comparability. Changing the framework mid-process makes rounds incomparable and invites the appearance of moving the goalposts.
Where costs go
This depends on whether a detailed appraisal will follow.
| Situation | How cost is handled |
|---|---|
| First-pass assessment, no detailed appraisal planned | Capital cost, whole-life cost, affordability and cost-related risk may be incorporated directly within the MCA framework |
| Detailed appraisal anticipated | Costs are assessed separately and considered alongside the MCA results |
The outcome of the stage is either identification of a preferred option or pathway, or a shortlist for further appraisal.
The MCA process, step by step
Step 1: Understand wider system impacts
The first step is to understand the wider system impacts associated with the intervention options, achieved through systems thinking.
This means considering how interventions influence not only the primary asset or system of interest, but also the indirect effects and wider environmental, social, economic, operational and resilience outcomes connected to it.
These impacts provide the basis for developing the MCA framework, and for ensuring that all significant aspects of system performance are considered.
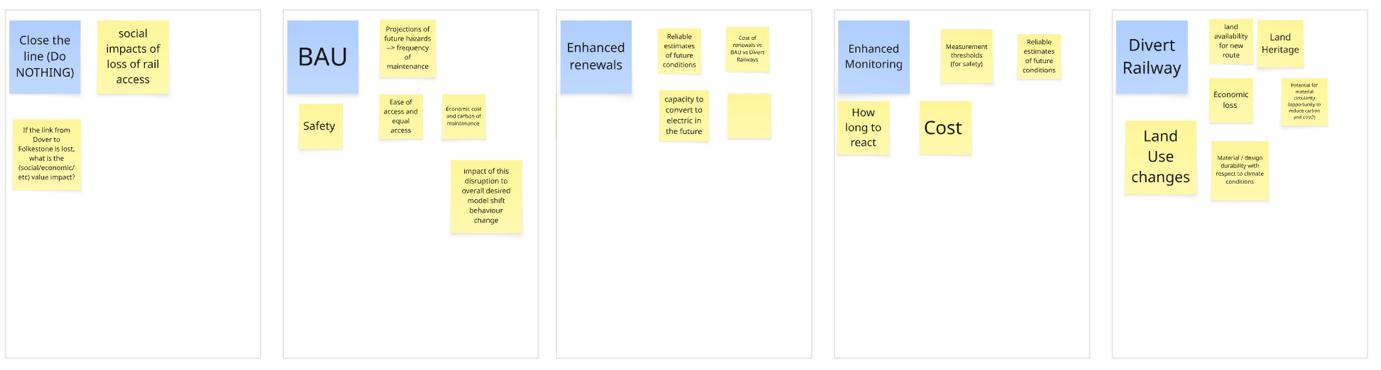
Figure 1. Capturing wider impacts and performance measures associated with each intervention.
Step 2: Identify assessment dimensions
The wider system impacts are used to identify the assessment dimensions, aligned with the case study and project objectives. In some cases, existing organisational assessment dimensions may be adopted instead.
Dimensions represent the higher-level outcomes or themes against which options will be evaluated, and provide the structure for organising criteria.
Step 3: Develop the impact matrix
Once dimensions have been agreed and validated through stakeholder engagement, an impact matrix is developed.
The matrix links intervention impacts to the assessment dimensions, and is the basis for identifying criteria and indicators. It groups related impacts into common themes, ensuring all significant areas of performance are represented.
The matrix exists for traceability
Its stated benefit is providing traceability between identified impacts and the list of criteria generated for the case study.
Anyone can produce a list of criteria. The matrix is what lets you show where each one came from, which is what survives challenge.
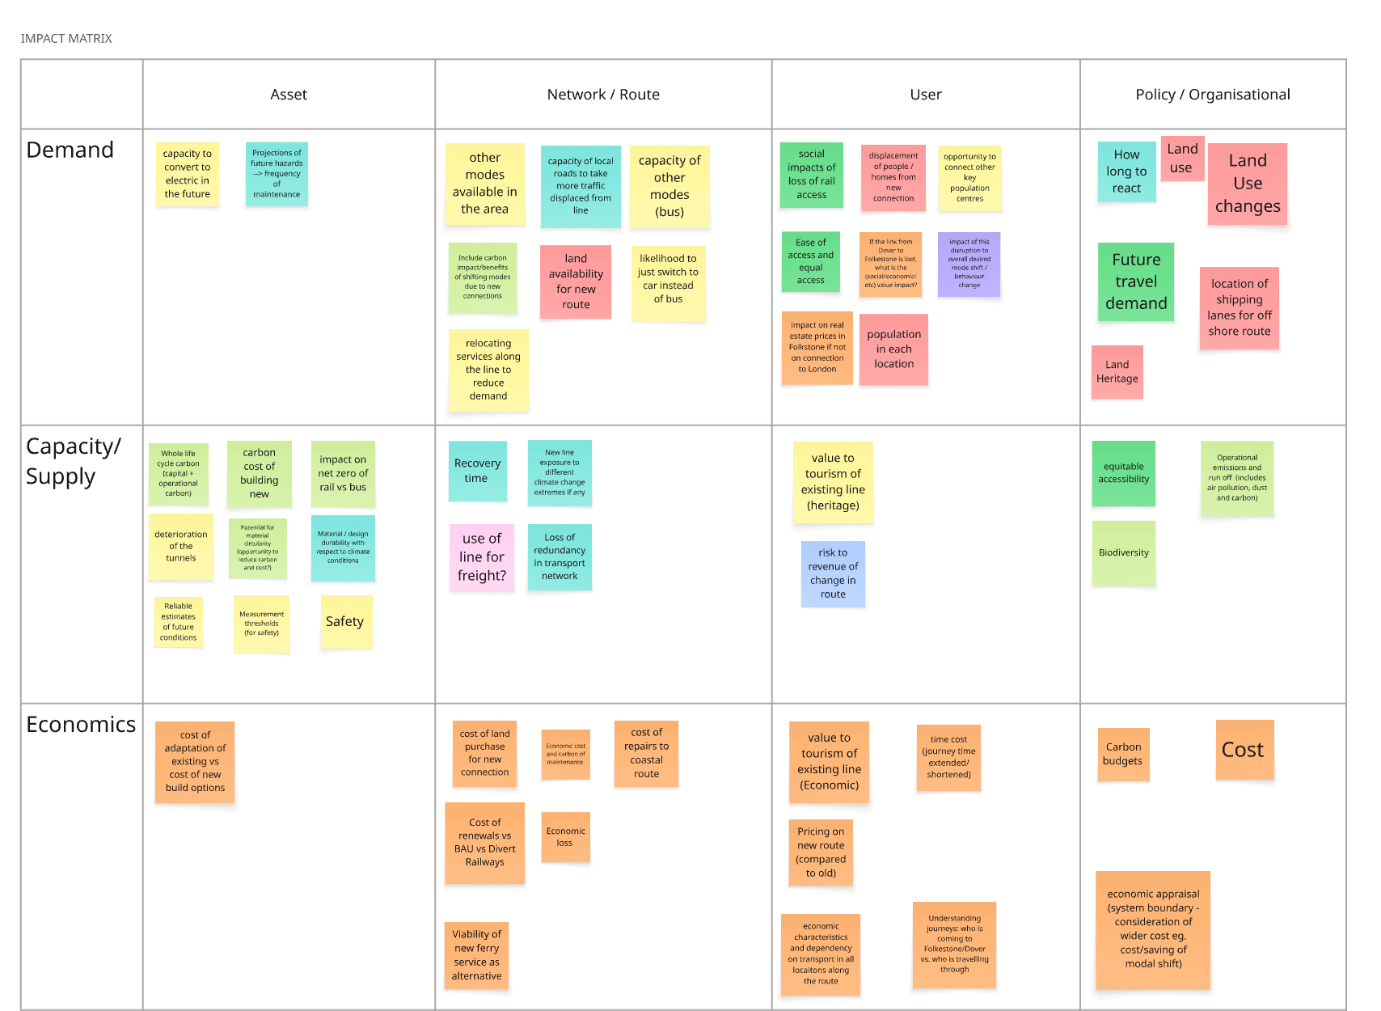
Figure 2. Mapping impacts across systems and dimensions.
Step 4: Develop criteria
Criteria may be developed using a combination of two approaches, which are meant to meet in the middle:
| Approach | Where criteria come from |
|---|---|
| Bottom-up | Derived from identified system impacts, organised in the impact matrix and translated into criteria |
| Top-down | Drawn from existing organisational criteria, such as key performance indicators |
Integrating the two ensures that both wider system considerations and organisational priorities are represented.
Each criterion is supported by indicators and measures:
| Term | Definition |
|---|---|
| Criterion | The outcome or aspect of performance assessed within a dimension |
| Indicator | The evidence or characteristic used to demonstrate performance against a criterion |
| Measure | The specific metric or qualitative assessment used to evaluate it |
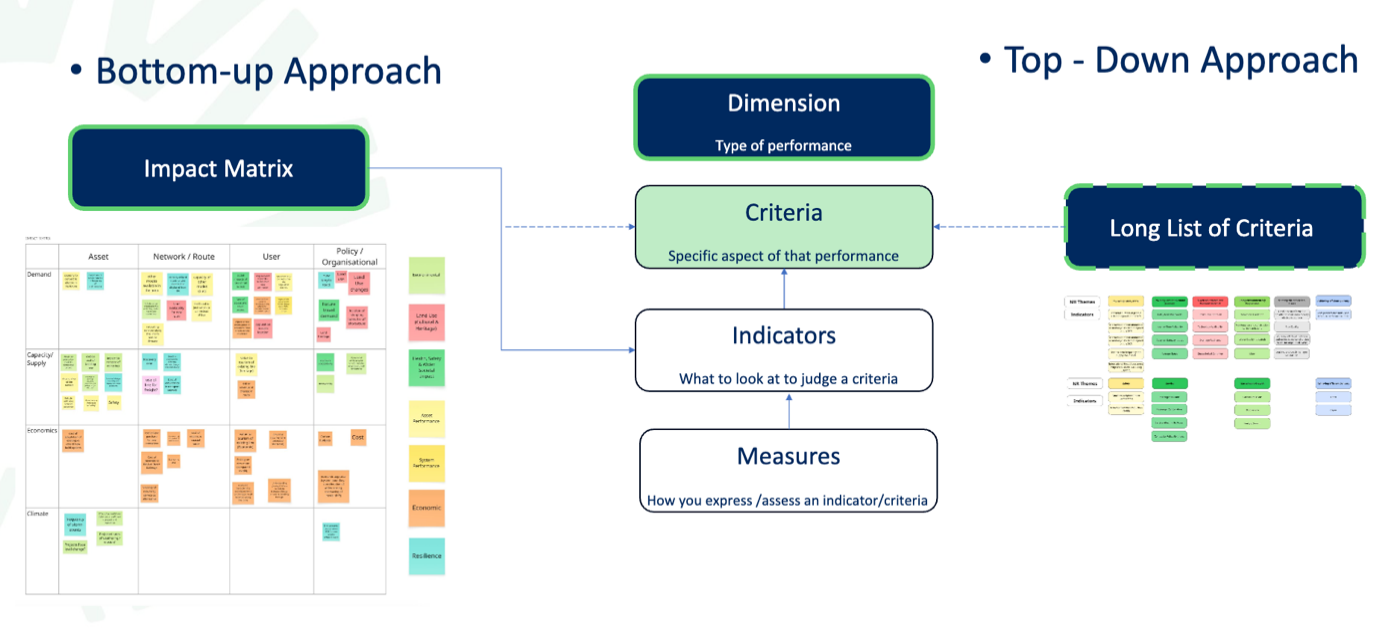
Figure 3. Bottom-up and top-down approaches to criteria selection, with the evidence to consider when assessing each criterion.
Step 5: Assign criteria weightings
The relative importance of each criterion, and of each dimension where appropriate, is established through a weighting process. Weightings may be derived through stakeholder workshops, pairwise comparison methods or similar structured approaches.
The process should be transparent and documented.
The worked pairwise method
The handbook describes a specific approach that is worth following closely:
- Divide stakeholders into two groups, and have each weight the criteria independently
- In each pairwise comparison, assign 1, 0.5 or 0, indicating relative importance against the criterion being compared
- Flag and document uncertainty and significant variation between the groups
- Hold a round of discussion between the two groups to reach a close consensus
- Take the average of the two groups' weightings as the final weight
Why two groups rather than one
Running the exercise twice independently turns disagreement into data. Where the groups agree, the weight is robust. Where they diverge, you have identified precisely which priorities are contested, and that gets a discussion rather than being averaged away silently.
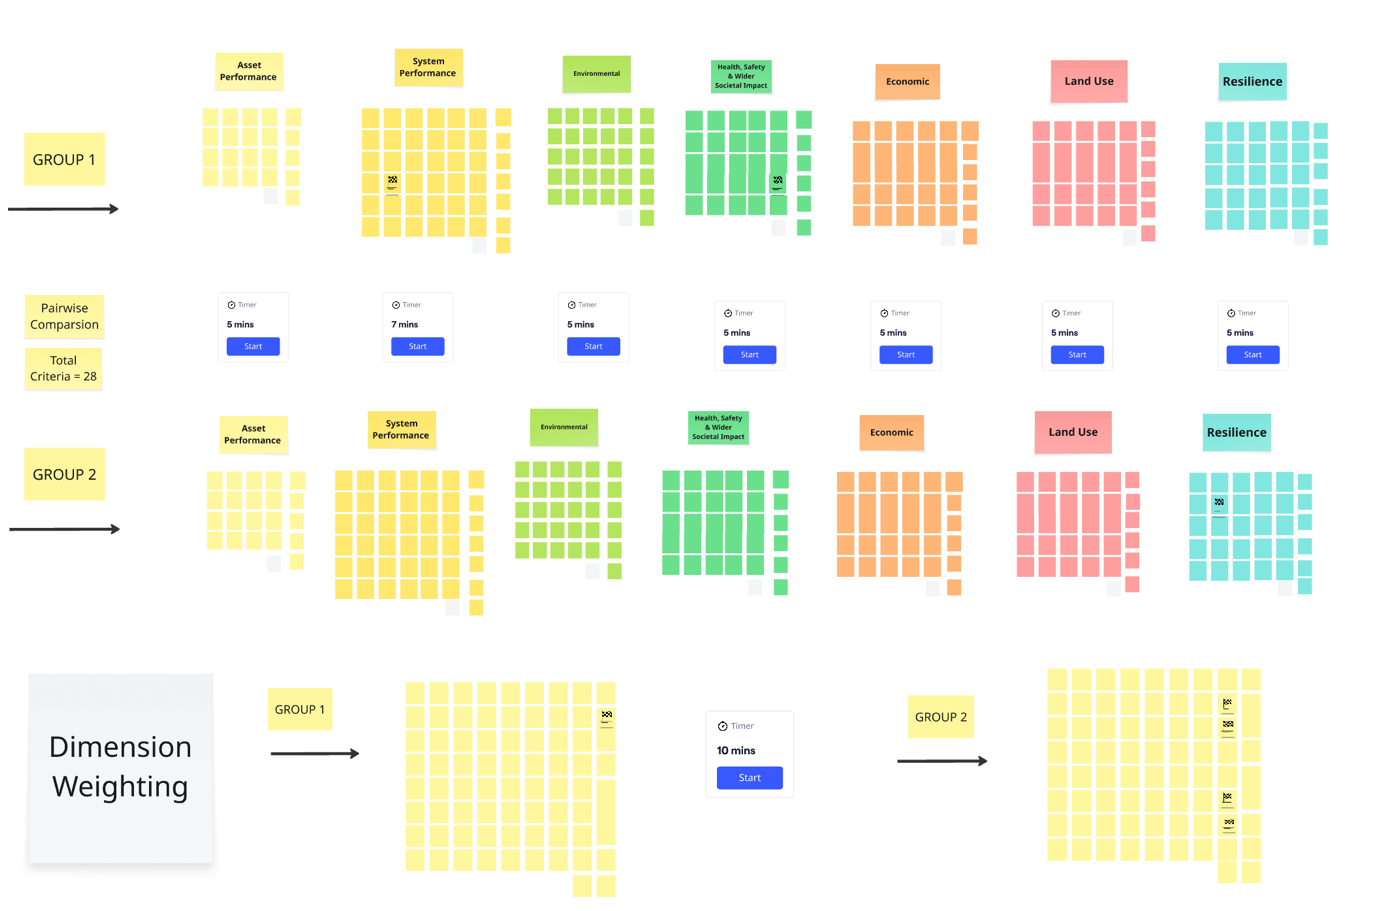
Figure 4. Pairwise comparison used to weight criteria and dimensions by dividing stakeholders into two groups.
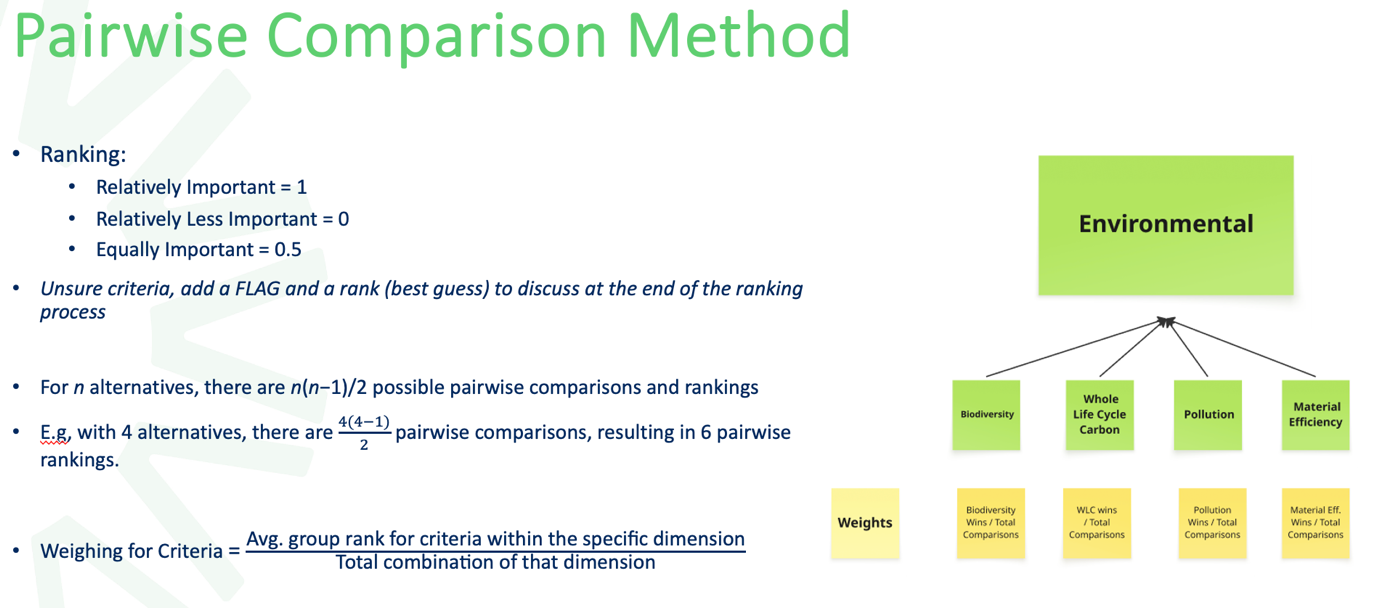
Figure 5. Pairwise comparison for weighting criteria.
Step 6: Score options
Each option is assessed against the agreed criteria. Scores may be supported by quantitative evidence, modelling outputs, qualitative assessments and expert judgement.
The scoring process should be undertaken consistently across all options, to ensure comparability and transparency.
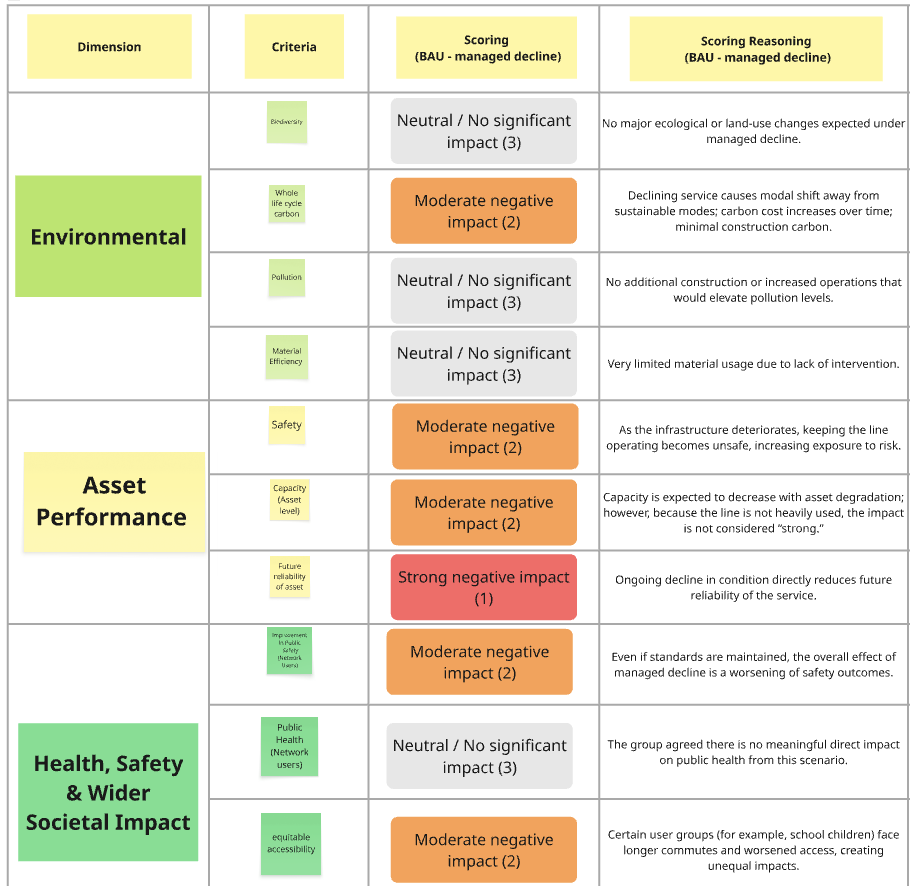
Figure 6. A five-point scoring method, recording the reasoning alongside each score for transparency and traceability.
Record the reasoning, not just the score
The example records reasoning alongside each score. A bare number cannot be challenged or revisited; a number with its justification attached can be.
Step 7: Determine performance level
Criterion scores are combined with their weightings and normalised, to determine the overall performance of each option and allow ranking. In some cases they may also be subject to sensitivity analysis.
The resulting performance levels provide the basis for identifying a preferred option or pathway, or for a further iterative appraisal stage.
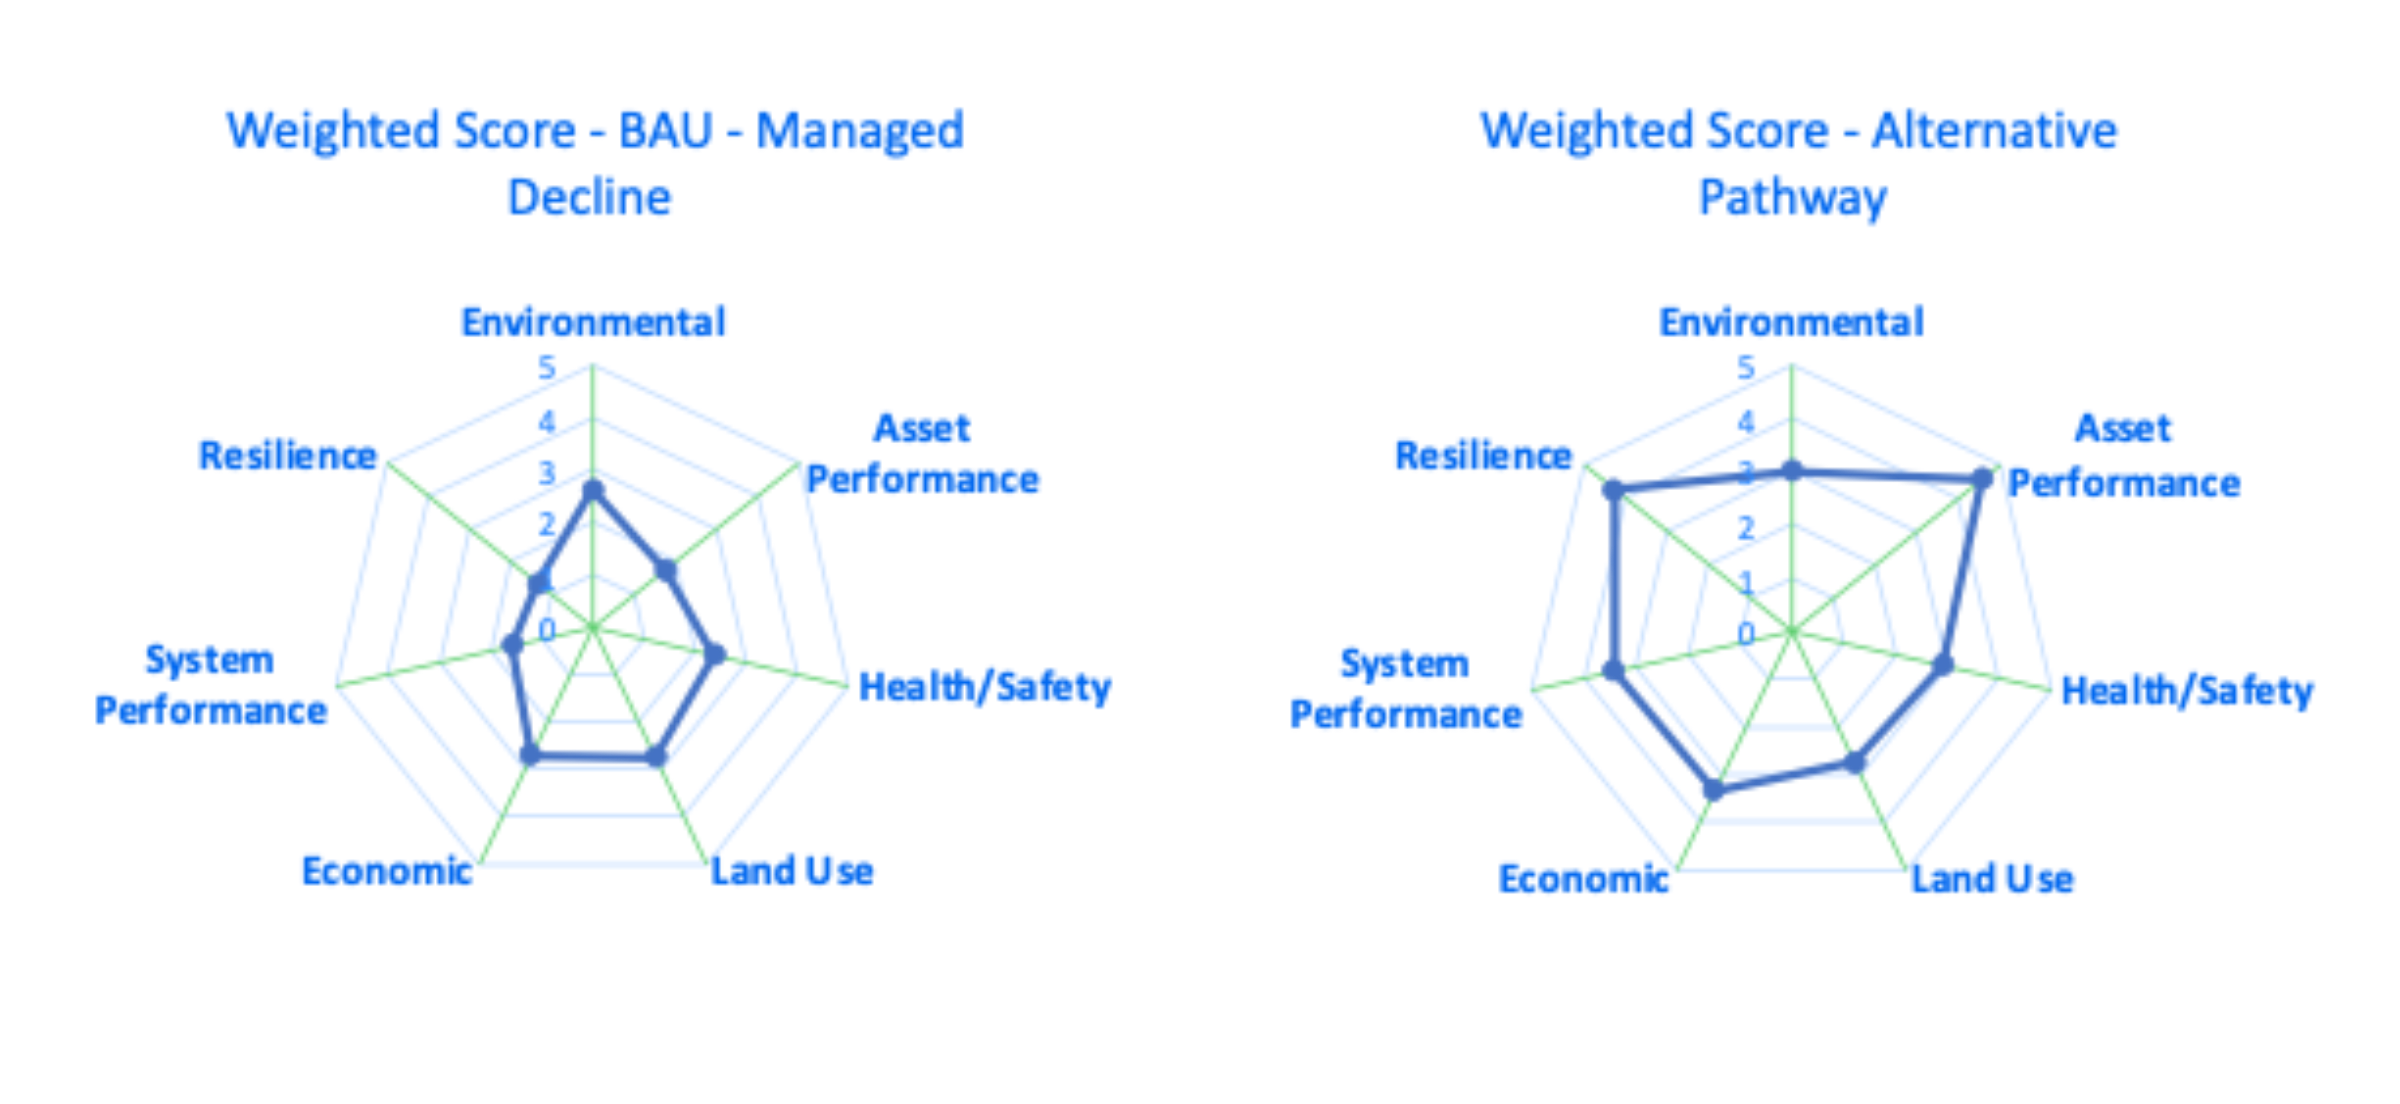
Figure 7. Aggregation of weighted MCA dimension scores into an overall performance number and performance level, for pathway comparison and selection.
Stage 2: Detailed appraisal and confirmation
Where required, shortlisted options are subject to more detailed appraisal. Depending on scale and complexity this may include Cost-Benefit Analysis and economic appraisal, used alongside the MCA findings to confirm the preferred option.
Why MCA is kept alongside economic appraisal
The handbook gives a clear reason: the MCA ensures that important social, wellbeing and environmental benefits that are difficult to monetise can still be considered in the decision.
An economic appraisal alone would quietly weight those at zero.
Avoiding double counting
Where a detailed economic appraisal is undertaken, costs should generally be assessed outside the MCA framework.
In those circumstances cost is either excluded from the MCA, or treated as a supporting measure rather than a scored criterion, since costs are already explicitly accounted for within the economic appraisal.
| What it assesses | |
|---|---|
| MCA | Non-monetised impacts and strategic trade-offs |
| Economic appraisal | Value for money, and the balance of costs and benefits |
This approach is consistent with HM Treasury Green Book supplementary guidance for business case development.
The iterative appraisal stage
Where detailed appraisal is required, the preferred intervention, combinations of interventions or pathways are further developed during portfolio optimisation, to mature the list of options and assess them at increasing levels of detail.
This is typically undertaken to support a Strategic Business Case, or to further optimise and run sensitivity analysis on option configurations.
At this stage additional information is incorporated, such as:
- Alternative configurations or variants, developed or modified for optimisation
- Option specification detail: material requirements, construction method, operational and maintenance requirements, service life, policy details
The process remains iterative, with more mature options reassessed using MCA and, where appropriate, more detailed economic appraisal.
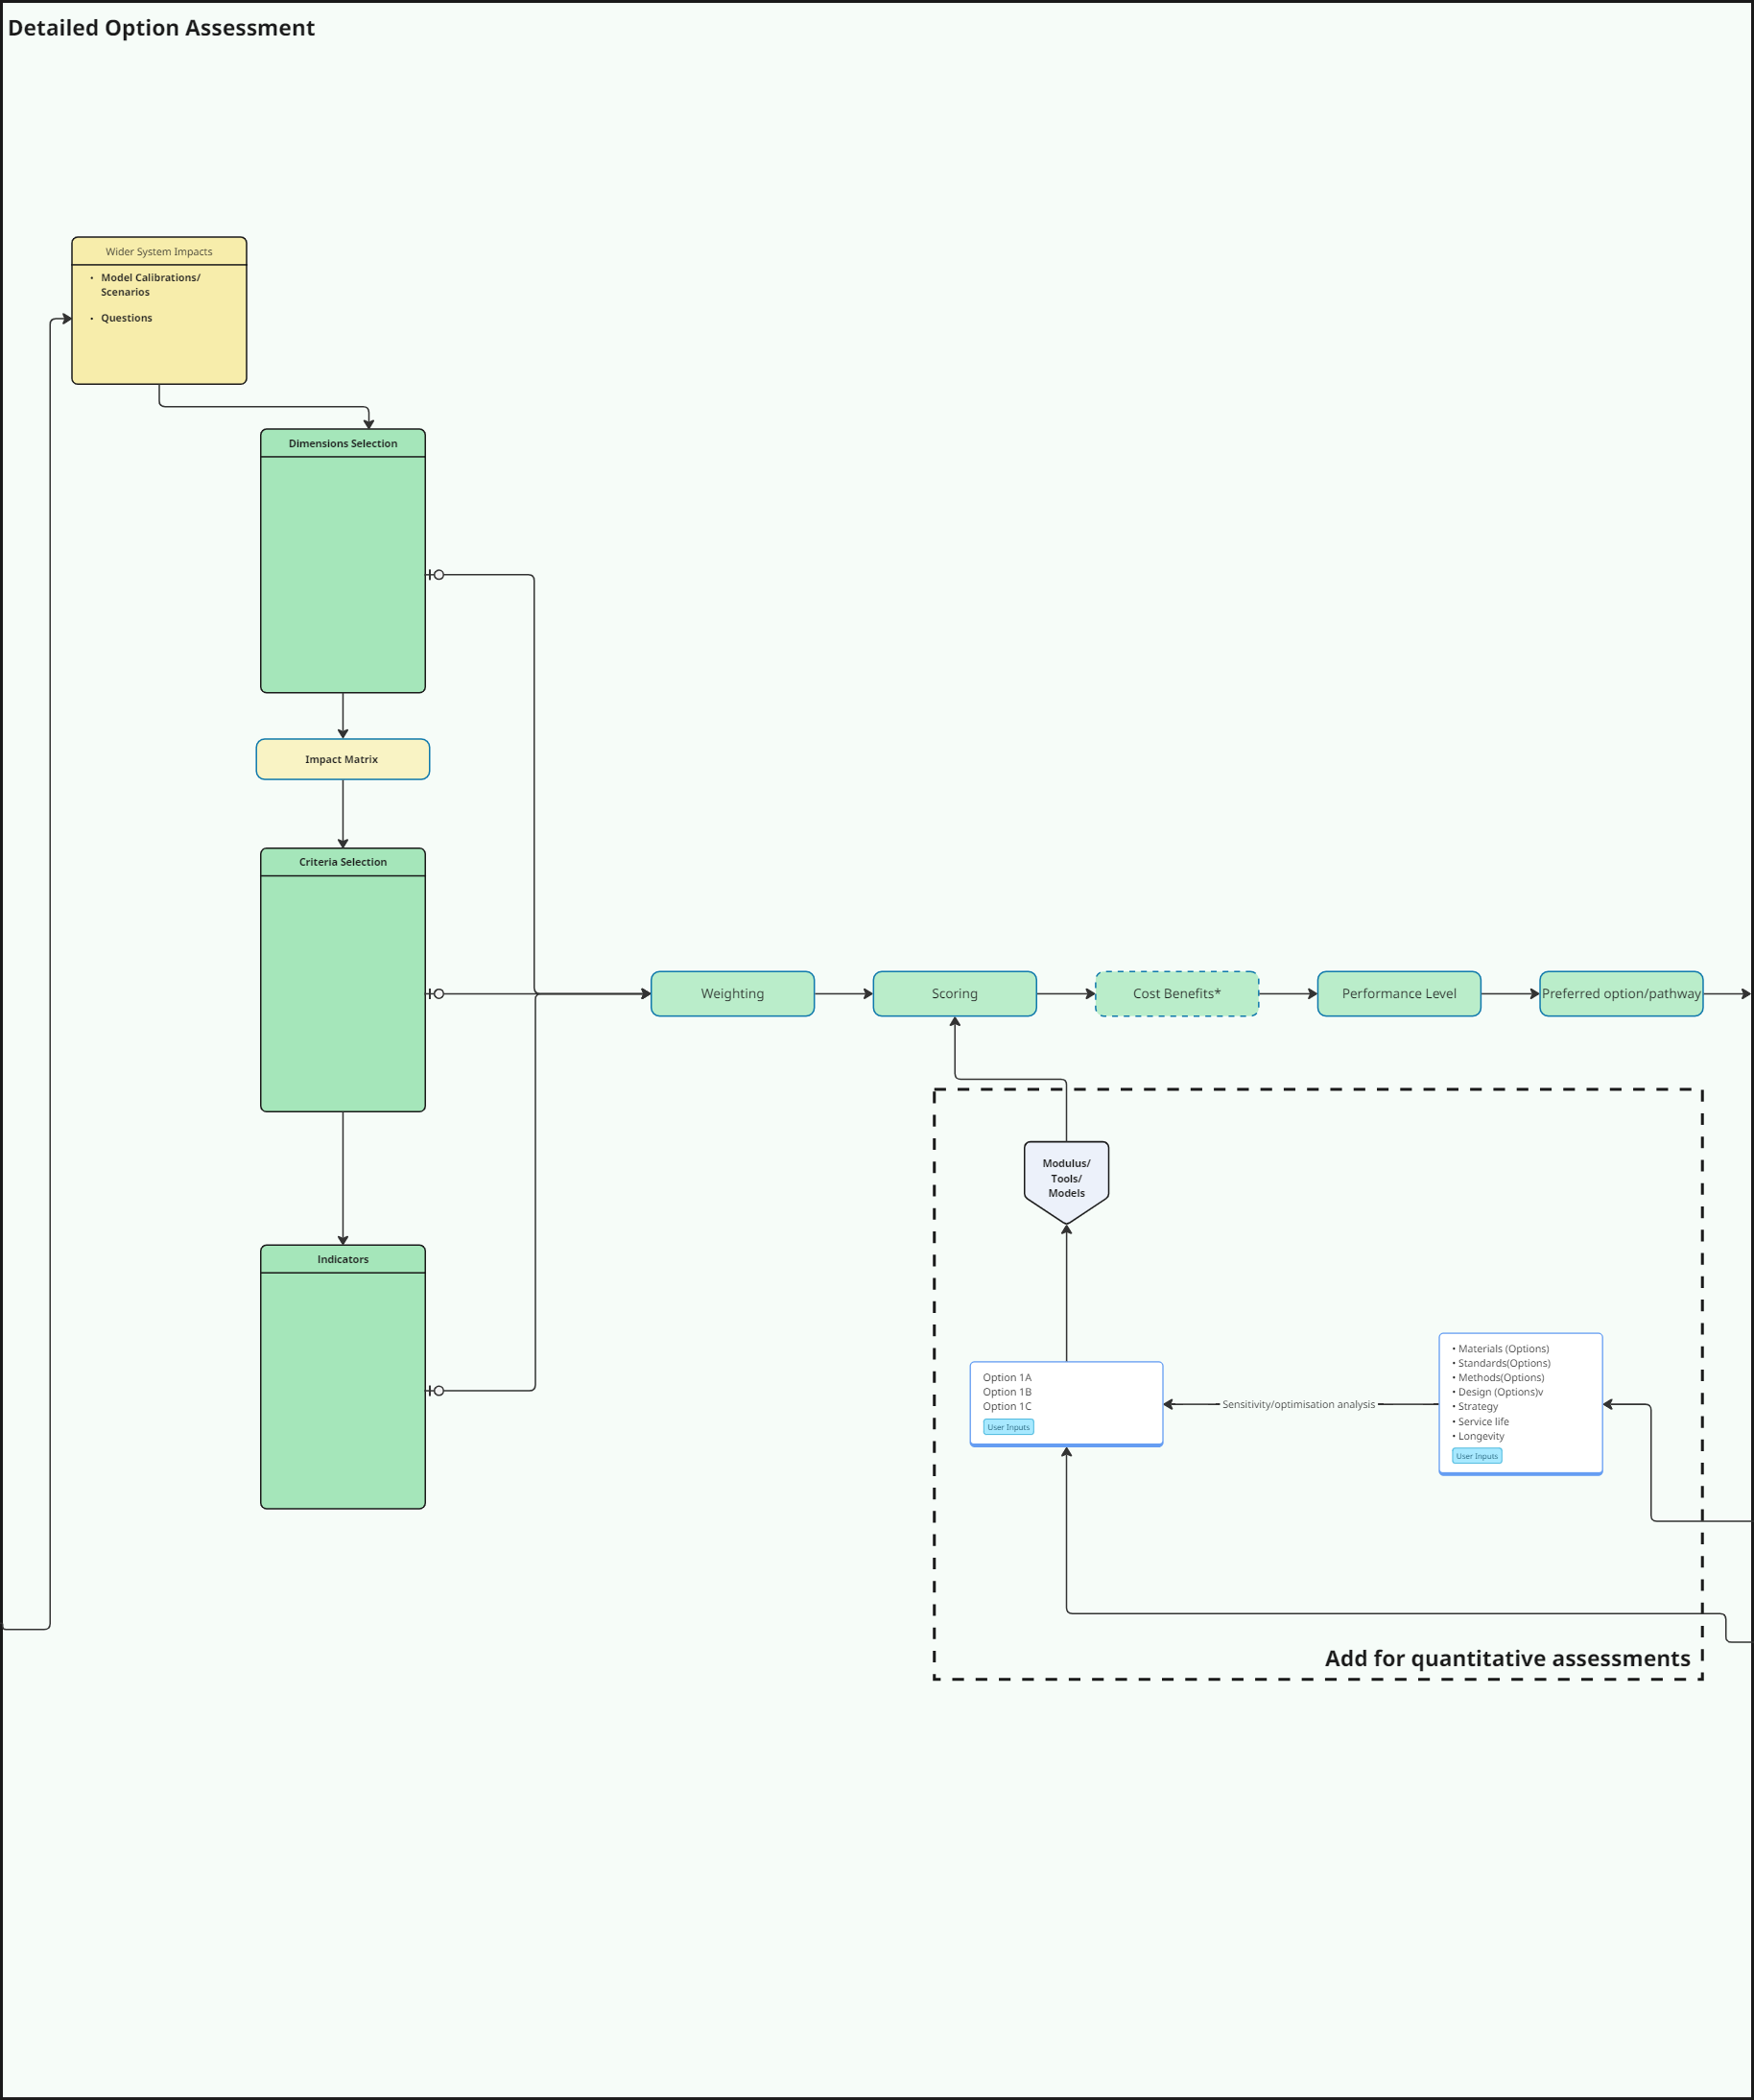
Figure 8. Option assessment workshop materials.
Engagement required
Stage 1 tools
- Brainstorming and systems mapping tools, such as Miro or Microsoft Whiteboard, to identify dimensions, criteria, indicators and weighting
- Activity sheets to support the assessment
- Pairwise comparison tables, Analytic Hierarchy Process (AHP) tools, or dedicated MCA software, to derive criteria weightings
- Spreadsheets or MCA tools for scoring, weighting, ranking and comparing options and pathways
- Existing organisational objectives and KPI libraries, to support the top-down development of dimensions, criteria and indicators
Stage 1 stakeholder engagement
| Session | Purpose |
|---|---|
| Stakeholder workshops | Identify wider system impacts and interdependencies |
| Framework workshops | Develop and validate assessment dimensions, criteria, indicators and measures |
| Criteria weighting workshops | Using pairwise comparison, structured voting or similar |
| Option scoring workshops | Assess intervention performance against agreed criteria |
| Validation session | Review results, challenge assumptions, and confirm preferred options or shortlists |
Stage 2 tools
- StratforDarts, an in-house tailored economic appraisal tool, and Cost-Benefit Analysis tools
- Option appraisal spreadsheets and decision-support tools, to compare refined intervention variants and pathways
Stage 2 stakeholder engagement
- Technical workshops and option refinement workshops, to explore alternative variants and optimise shortlisted options, combinations of interventions, or pathways
- Stakeholder review sessions, to validate assumptions, appraisal results and preferred solutions
- Expert interviews, to support cost estimation
Desk studies and data collection are not specified
Both stages list a "Desk studies and data collection" heading with nothing beneath it. The tools and engagement sections above are complete; this one was never written.
Output schema for the next process
The principal output is the preferred option, set of interventions or pathways, together with the technical, operational, environmental, economic and risk information needed for subsequent intervention bundling or implementation planning.
Outputs must keep their links backwards
To maintain transparency and traceability, outputs should retain clear links to the preceding risk reduction analysis, and to the assumptions and evidence used to rank and support option selection.
A preferred option that arrives without its reasoning cannot be defended at approval.
| Activity | Key output | Input to next process |
|---|---|---|
| Wider system impacts | System impacts arising from each intervention option or pathway | System impact register; input for dimension selection through wider system impacts, organisational and policy objectives |
| Impact matrix development | Intervention impacts categorised against assessment dimensions; traceability between impacts and criteria | Criteria and indicator development, derived from the impact matrix or an existing criteria list |
| Weightings | Weighting of each criterion and dimension | Scoring |
| Scoring | Agreed scoring scale and measures; scores for each option | Input to performance assessment and to economic assessment |
| Detailed economic assessment | CBA, cost-effectiveness and economic assessment | Economic appraisal output |
| Performance assessment | Weighted scores, performance of each option, ranking, and sensitivity or uncertainty testing showing how changes in assumptions influence ranking | Preferred option or pathway |
| Option optimisation | Mature list of options and variants with increased detail; updated measures for scoring | Input to scoring, for updated option rankings |
| Preferred option or pathway | Selected and confirmed preferred options, with the evidence base | Input to portfolio optimisation, for a further detailed option stage or implementation planning |
Overall output
- Preferred option or pathway, with design detail appropriate to the iterative stage reached
- Performance and risk evidence associated with the preferred option
These provide what Portfolio Optimisation needs for schedule and resource planning.