

Risk Assessment Module
The Risk Assessment Module provides a structured process for evaluating the risk associated with the deterioration, failure, capacity loss or performance degradation of individual assets, infrastructure systems and wider transport networks.
It combines four inputs:
- Current asset condition
- Predicted deterioration
- Probability of capacity or performance loss
- The consequences of that degradation
Where appropriate, sustainability considerations may also be built into the consequence assessment, or used alongside the resulting risk scores.
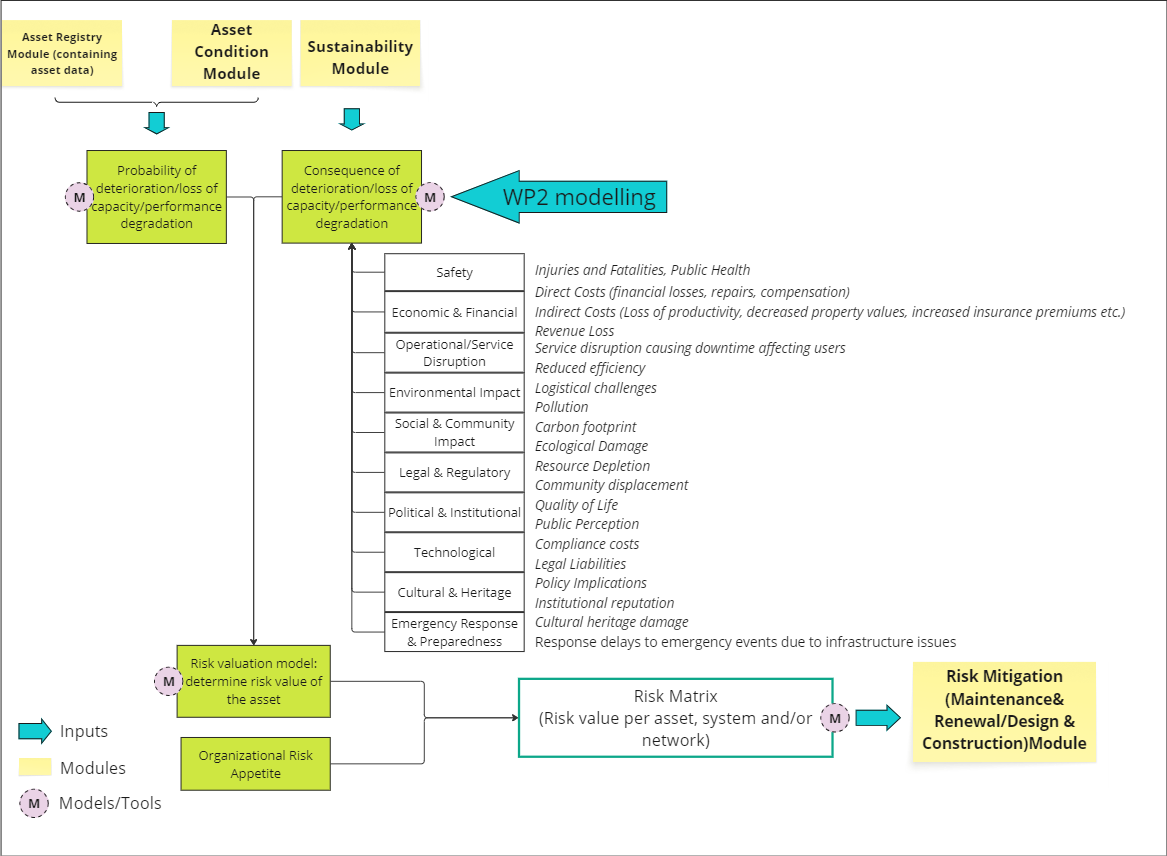
Figure 1. The Risk Assessment Module.
The underlying logic
The assessment follows a likelihood and consequence logic.
| Term | What it represents |
|---|---|
| Likelihood | The probability that an asset will deteriorate, fail, or lose required performance within a defined period |
| Consequence | The severity of the resulting impacts |
Risk values may be calculated for individual assets and then aggregated to system or network level, to support comparison, prioritisation and intervention planning.
Why this is not just condition scoring
The handbook makes the distinction explicit with an example: two assets with similar condition scores may receive different risk ratings, because they have different probabilities of performance loss, different capacity constraints, different network roles, or different consequences if service is disrupted.
Condition tells you about the asset. Risk tells you what it would mean if the asset let you down.
Questions answered
The purpose is to identify where deterioration, failure or loss of performance could create the greatest adverse impacts, and therefore requires management attention.
- How is the asset expected to deteriorate over time?
- What is the probability that an asset will deteriorate, fail, or lose capacity within the assessment period?
- What consequences could arise from deterioration, failure, or service degradation?
- How do safety, economic, operational, environmental, social, legal, institutional, technological, cultural and emergency-response impacts differ between assets?
- Which assets, systems or network components present the highest overall risk?
- Where should inspection, maintenance, renewal, adaptation or investment be prioritised?
- How may future climate conditions, changing demand, or travel behaviour alter asset and network risk profiles?
Methods and principles
The assessment is based on the general relationship:
Risk = Likelihood × Consequence
Depending on data availability, likelihood and consequence may be represented using quantitative values, ordinal scores, qualitative categories, or a hybrid approach.
1. Obtain the asset and network context
The asset registry identifies the assets in scope and provides asset type, location, current score, functional role and network position.
2. Obtain current asset performance
Current condition is represented using condition scores, performance indicators, inspection results or other asset-specific measures. Where available, condition-deterioration curves are used to estimate how performance is likely to change over time.
3. Estimate likelihood of deterioration or performance loss
The likelihood component represents the probability, within a defined period, of:
- Physical deterioration
- Failure
- Reduction in capacity
- Loss of functionality
- Degradation of service
It may be estimated using historical records, deterioration models, reliability models, statistical analysis, machine-learning models, thresholds, or expert judgement.
4. Assess consequence of deterioration or failure
The consequence assessment spans ten dimensions:
| Dimension | |
|---|---|
| Safety | Harm to people |
| Economic and financial | Direct and indirect cost |
| Operational and service disruption | Loss of the service itself |
| Environmental | Damage to the natural environment |
| Social and community | Effects on the people served |
| Legal and regulatory | Compliance implications |
| Political and institutional | Effects on the organisation and its standing |
| Technological | Effects on systems and their interfaces |
| Cultural heritage | Loss of heritage value |
| Emergency response and preparedness | Effects on the ability to respond |
5. Consider asset capacity and network role
The assessment considers whether remaining asset capacity is sufficient to meet demand, and how deterioration or failure may affect network performance. Relevant factors include:
- Asset criticality
- Available alternatives
- Redundancy
- Duration of disruption
- Users affected
- Recovery requirements
6. Incorporate sustainability where relevant
Sustainability indicators such as carbon emissions, life-cycle impacts, material efficiency, biodiversity, and social or socioeconomic effects may either contribute to consequence scoring, or be retained as supplementary decision criteria.
Avoid double counting
The handbook is explicit that their inclusion should be transparent and should avoid double counting impacts already represented elsewhere.
Carbon is the obvious trap. If emissions have already been monetised inside the economic consequence score, adding a separate carbon criterion counts the same impact twice and distorts the ranking.
7. Calculate and classify risk
Likelihood and consequence values are combined through a risk valuation model to derive an overall risk measure for each spatial unit or asset.
In a simplified approach, climate hazard exposure is integrated with infrastructure condition and future transport demand, representing the combined effects of environmental stress, asset vulnerability and network usage. Resulting scores can be classified into categories such as low, medium and high risk, to support spatial comparison, hotspot identification and intervention prioritisation.
8. Aggregate and prioritise risks
Asset-level risk values may be aggregated to corridor, system, portfolio or network level.
Aggregation can hide the thing you are looking for
The handbook gives a specific instruction: aggregation should preserve the visibility of isolated high-risk assets, and should not rely solely on averages that may conceal localised critical risks.
A corridor of sound assets containing one critical failure point will average out to an acceptable score. The one asset that matters is exactly the one the average erases.
Scaling the method to the evidence
The level of sophistication of the risk model can be adapted to the available evidence. This is one of the more practically useful passages in the handbook.
| Evidence available | Appropriate approach |
|---|---|
| Limited data | Deterministic scoring, or risk-matrix approaches |
| Comprehensive historical climate, traffic, condition and maintenance datasets | Machine-learning and other data-driven models, predicting future rates of infrastructure performance deterioration |
The gain from the second is specific: it allows future risk assessments to account explicitly for nonlinear and interacting effects between climate hazards, traffic demand and asset condition, providing a more dynamic basis for forecasting and decision-making.
The six qualities the method must have
Whichever level is used, the method should be:
Transparent, repeatable, proportionate to the available evidence, consistent across comparable assets, and capable of representing uncertainty and scenario-dependent change.
Tools and models
| Group | Tools |
|---|---|
| Asset condition and deterioration models | Condition-deterioration curves, deterioration-rate models, condition-transition or Markov models, survival or reliability models, statistical or machine-learning prediction models, engineering judgement where data are limited |
| Likelihood and probability models | Failure-probability models, probabilistic deterioration models, threshold-based performance-loss models, Bayesian or reliability-based models, scenario analysis and expert elicitation |
| Asset capacity and performance models | Structural or operational capacity models, traffic-carrying or service capacity models, service-level thresholds, residual capacity under deteriorated conditions, capacity reduction under disruption |
| Consequence and network-impact models | Traffic assignment and rerouting models, travel-time and delay models, accessibility and connectivity analysis, network criticality and redundancy analysis, economic appraisal and user-cost models, safety and service-impact models |
| Sustainability and life-cycle tools | Carbon accounting, life-cycle assessment, material and energy-use analysis, environmental and biodiversity indicators, social and socioeconomic assessment |
| Risk valuation and decision-support tools | Deterministic risk equations, probabilistic risk models, weighted multi-criteria assessment, risk matrices, scoring and ranking models, GIS-based risk mapping, asset-management databases, dashboards and decision-support platforms |
Testing the result, not just producing it
Where uncertainty is significant, the handbook recommends sensitivity analysis, scenario analysis, confidence scoring, or Monte Carlo simulation to test how robust the resulting risk priorities actually are.
A ranking that reorders under a small change in assumptions is not a ranking anyone should invest against.
Inputs: data sources
Asset registry data
Asset identifier, type and classification; geographic location; ownership and responsible authority; construction, installation or renewal date; design characteristics; current asset score; functional role and network connections.
Asset condition and performance data
Inspection and survey records; condition scores and performance indicators; defect and failure records; maintenance and repair history; monitoring or sensor data; operational performance data; condition-deterioration curves; capacity and serviceability thresholds.
Likelihood and deterioration data
Historical deterioration rates; failure frequencies; transition probabilities; reliability parameters; modelled probability of capacity or performance loss; expert-assigned likelihood categories where evidence is limited.
Transport demand and network data
Current and projected demand; travel-behaviour scenarios; origin-destination data; network topology; traffic flow, speed and congestion data; alternative routes and redundancy; accessibility and connectivity indicators; critical services and user groups.
Consequence and criticality data
Accident and safety records; repair and replacement costs; user delay and disruption costs; revenue or productivity losses; service-level requirements; population and community exposure; critical facilities and services; legal and regulatory requirements; emergency-response requirements; cultural or heritage designations.
Sustainability data, where applicable
Carbon-emission factors; life-cycle inventory data; energy and material use; environmental impact indicators; biodiversity and habitat data; social and socioeconomic indicators.
Future scenario data, where applicable
Future climate conditions; future demand projections; travel-behaviour changes; asset-use scenarios; policy or service-level changes.
Where the data comes from
Inputs may be obtained from asset-management systems, inspection databases, transport authorities, GIS repositories, monitoring systems, engineering models, historical incident records, stakeholder consultation and expert elicitation.
Outputs
The primary output is a risk value for each asset, system or network component.
Depending on the method selected, this may be presented as:
- a numerical score
- a probability-based value
- a qualitative category, such as low, moderate, high or very high risk
This section is brief in the source
The heading promises "risk scores, matrices, prioritised risk profiles", but only the risk value itself is described. The matrices and prioritised profiles are named in the heading and in the tools list, yet not documented as outputs.
Dependencies on other modules and processes
| Module or process | What it contributes |
|---|---|
| Asset registry | Defines the assets in the assessment; provides identifiers, locations, classifications, current scores and links between datasets. Consistent referencing and data quality are essential. |
| Asset performance | Current-condition indicators, deterioration relationships, and estimates of future performance that underpin likelihood scoring |
| Asset capacity | Determines whether an asset can continue to meet required service levels under current, deteriorated or future-demand conditions. Capacity loss creates the link between physical deterioration and consequence. |
| Travel-behaviour modelling (WP2) | Current and future demand scenarios, influencing utilisation, service impacts and traffic redistribution; the number and type of users affected; network-level consequences |
| Consequence assessment | Consistent estimates of safety, financial, operational, environmental, social, legal, institutional, technological, heritage and emergency-response impacts |
| Sustainability assessment, where included | Carbon, environmental, life-cycle, material-efficiency, biodiversity and socioeconomic indicators, either folded into consequence scoring or kept as parallel criteria |
| Climate or hazard scenario generation, where required | Scenario inputs for assessing how future external conditions affect deterioration probabilities, asset capacity or consequences |
| Intervention planning (optioneering) | Uses risk results for maintenance, renewal, adaptation, investment and optimisation decisions |
Risk assessment is not a one-off
Implemented interventions change condition, likelihood, capacity and consequence values, which requires iterative reassessment. A risk profile describes the network as it was before the programme, and stops being true as soon as the programme starts.
Two dependency headings appear to be missing from the source
Two of the rows above, Asset capacity and Consequence assessment, appear in the source as paragraphs with no heading of their own, attached to the end of the preceding entry.
They have been given headings here because they plainly describe different dependencies from the ones they were appended to. The authors should confirm the intended structure.