

Resilience Module
The Resilience Module evaluates how assets and transport networks may perform under extreme-weather and other hazard scenarios.
It combines four things into resilience-focused evidence:
| Component | The question it settles |
|---|---|
| Hazard exposure | What the asset is subjected to |
| Asset vulnerability | Whether it can withstand it |
| Transport disruption | What happens to journeys if it cannot |
| Impact assessment | What that costs, and to whom |
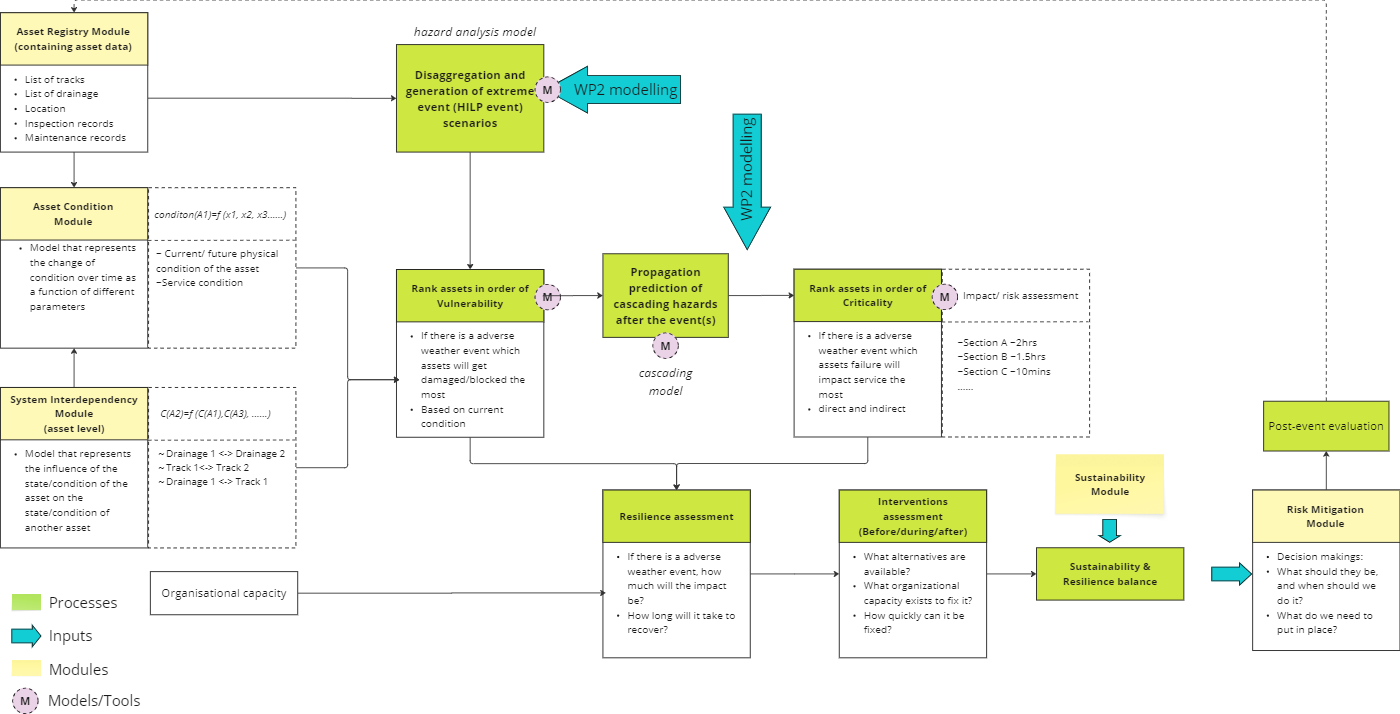
Figure 1. The Resilience Module.
A boundary the handbook states twice
The Resilience Module is related to the wider asset and network evaluation framework, but it does not directly feed the risk valuation model.
The point is repeated in the dependencies section: this module and Risk Assessment may share underlying data and contextual evidence, but Resilience does not provide a direct input to the risk valuation model or the risk matrix.
Stating it twice suggests the authors expected the two to be conflated. They are separate assessments that happen to draw on overlapping data.
Questions answered
The module addresses four questions, which follow the chain from exposure to weakness:
- Which assets or network locations are exposed to extreme-weather or other hazard scenarios?
- How likely is an exposed asset to experience damage, failure, or loss of functionality?
- What transport disruption and wider impacts could occur during a hazard event?
- How robust is the asset or network under stress, and where are the principal resilience weaknesses?
Note that exposure alone answers nothing. An exposed asset that can withstand the hazard is not a resilience problem, and a vulnerable asset with a ready diversion may not be either.
Methods and principles
The method runs as five stages.
1. Define relevant hazard scenarios
Including event intensity, duration, probability and spatial extent.
All four matter independently. A short intense event and a long moderate one place very different demands on the same asset.
2. Assess exposure
By spatially linking hazards with assets, routes and network components.
3. Estimate vulnerability or failure likelihood
Using asset condition, design characteristics, thresholds, or fragility relationships.
4. Model transport disruption
Including capacity loss, closure, delay, diversion and connectivity effects.
5. Evaluate impacts and stress-test
Evaluate direct and indirect impacts, and compare performance across baseline and stress-test scenarios.
The baseline comparison is what makes it evidence
Modelling a hazard scenario on its own tells you what happens. Comparing it against the baseline tells you how much of that is attributable to the hazard, which is the number a decision actually needs.
Tools and models
| Tool class | |
|---|---|
| GIS-based hazard and exposure mapping | Locating hazards against assets |
| Hazard models | Flood, heat, drought, heavy rainfall, storm and others |
| Vulnerability, fragility and failure-probability models | Whether an exposed asset fails |
| Transport models | Network, accessibility, diversion and disruption modelling |
| Analysis tools | Scenario analysis, stress testing, sensitivity analysis and impact assessment |
Several of these overlap directly with the Integrated Modelling Platform, which supplies hazard modelling and transport simulation capability.
Inputs: data sources
| Source | What it provides |
|---|---|
| Asset registry information | Asset type, location, current score, and network role |
| Asset condition and design data | Condition, performance, inspection, maintenance and design data |
| Hazard records and scenarios | Historical hazard records, and future climate or hazard scenarios |
| Environmental datasets | Topography, flood depth, temperature, rainfall, drought, wind and others |
| Transport data | Traffic demand, network topology, alternative routes, capacity, travel time, critical-service data |
| Stakeholder and operational information | Service requirements, recovery arrangements, and acceptable disruption |
Acceptable disruption is an input, not a finding
The last item is easy to overlook. How much disruption counts as acceptable is a judgement the operating organisation makes, and it has to be supplied to the assessment rather than derived from it. Two networks with identical modelled disruption can reach opposite conclusions on this basis.
Outputs
Hazard and vulnerability
- Hazard exposure indicators, such as flood depth, heat intensity, or duration of exposure
- Asset vulnerability and failure-likelihood estimates
Disruption and resilience
- Transport disruption indicators: capacity loss, closure duration, delay, diversion, and accessibility loss
- Resilience indicators describing robustness, redundancy, vulnerability and criticality
Recovery
Recovery metrics, such as:
| Metric | |
|---|---|
| Time to restore service | How long until normal operation returns |
| Recovery rate | How quickly it improves |
| Residual performance during recovery | What the network still delivers while impaired |
Residual performance is the practically useful one
Time to restore treats the recovery period as a single blank. Residual performance describes what the network is actually doing throughout it, which is what determines the real cost of an outage.
Comparison and prioritisation
- Stress-test outputs comparing asset and network performance across hazard severities, climate scenarios, and demand assumptions
- Maps and prioritised profiles identifying resilience hotspots and assets requiring further investigation or adaptation
Dependencies on other modules and processes
| Module or process | The relationship |
|---|---|
| Asset Registry | Provides asset identifiers, locations, classifications, current scores and network relationships |
| Asset Performance | Provides current condition and deterioration information, used to interpret vulnerability and loss of functionality |
| Climate and hazard modelling | Supplies the extreme-weather and future hazard scenarios used in stress testing |
| Transport demand and network modelling | Supports disruption, diversion, capacity and accessibility analysis |
| Sustainability assessment | May provide complementary environmental and socioeconomic impact information |
| Risk reduction and optioneering | May use resilience outputs to identify and assess adaptation or mitigation measures |
| Risk Assessment | May share underlying data and contextual evidence, but Resilience does not provide a direct input to the risk valuation model or risk matrix |
Climate and hazard modelling, and transport demand and network modelling, are both supplied by the Integrated Modelling Platform rather than by another DSP module. See Integration with IMP.