

IMP components
The IMP consists of nine different components, which together enable developing the weather event and the transport scenario for a particular region in the UK.
This page is the map. Each component gets a short description of what it contributes and a link to the chapter that covers it properly.
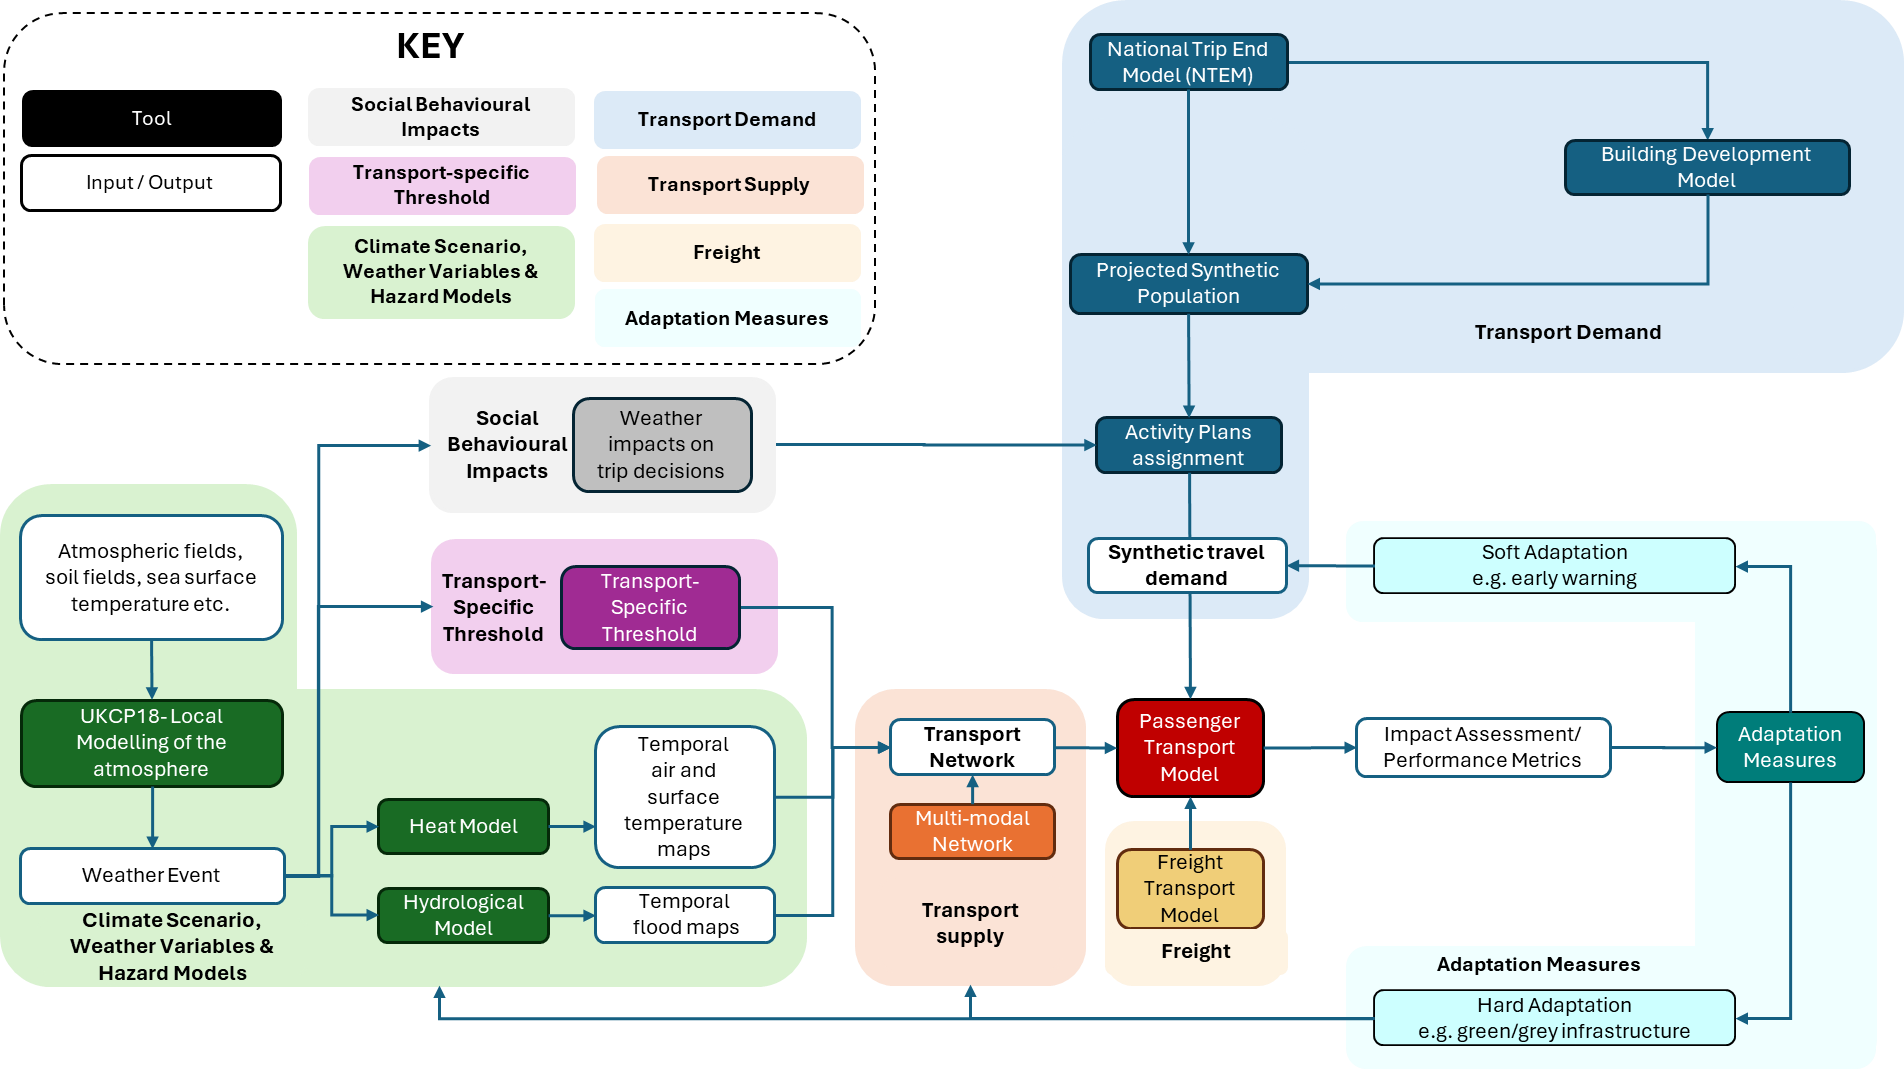
Figure 2. The IMP components and their connections.
At a glance
| Component | Contributes | Key tools |
|---|---|---|
| Climate scenarios | Rainfall and temperature to force the hazard models | UKCP18 |
| Hazard models | Flood depth and heat exposure over space and time | CityCAT, UrbClim, HiREx |
| Social behavioural impacts | How travel choices shift under hazard conditions | |
| Transport-specific thresholds | The point where a hazard becomes a transport problem | |
| Transport demand | Who travels, where, when and why | NTEM, SILO, SPENSER, MITO |
| Transport supply | The network they travel on | MATSim networks, GTFS |
| Transport models | The simulation that runs demand over supply | MATSim |
| Performance metrics | Impact and resilience, quantified | POESE framework |
| Adaptation measures | Interventions to test against the baseline | |
| The resilience tool | Empirical link-level sensitivity to rainfall | GLM Resilience Model |
| The IMP software platform | Orchestration that runs it all repeatably | Apache Airflow, Docker |
Building the weather event
Climate scenarios
Climate scenarios define plausible present or future climatic conditions, based on assumptions about greenhouse gas emissions, socioeconomic development and climate change.
The IMP uses climate projections and observed weather data to derive weather variables such as rainfall and temperature. These provide the meteorological forcing, which is the input that drives everything downstream in the hazard models.
Read more: Climate scenarios
Hazard models
Hazard models translate weather and climate drivers into spatial and temporal representations of hazards affecting transport infrastructure and users.
Within the IMP these are flood modelling with CityCAT and urban heat modelling with UrbClim and HiREx. They produce outputs such as time-varying flood depth and high-resolution heat-exposure information.
Read more: Hazard models
Transport-specific thresholds
A threshold defines the point at which a hazard begins to affect a transport receptor, causing reduced service quality, operational disruption or physical damage.
Thresholds may be drawn from infrastructure design standards, operational limits or observed impacts. They are what turns hazard intensity into a consequence for road and rail systems. Thirty millimetres of standing water is a number until a threshold says it closes the road.
Read more: Transport thresholds
Building the transport scenario
Social behavioural impacts
These represent changes in people's travel and activity behaviour in response to weather and hazard conditions.
Such changes modify transport demand directly, as people reduce, reschedule or avoid trips during hazardous conditions such as heatwaves or flooding.
Read more: Social behavioural impacts
Transport demand
Transport demand represents the movement of people and goods through the transport system.
The IMP represents it through synthetic populations, individual activity plans, freight activity plans and projected traffic demand, supplying the traveller and freight movements that are then simulated on the network.
Read more: Transport demand
Transport supply
Transport supply is the physical and operational system available to move people and goods.
It is represented as digital transport networks containing nodes, links and attributes such as speed, capacity and permitted modes, together with public transport stops, routes, services and timetables where multimodal transport is modelled.
Read more: Transport supply
Transport models
Transport models combine demand and supply to simulate how travellers, freight vehicles and transport services interact with the network.
Within the IMP, models such as MATSim simulate individual travel and network conditions, making it possible to quantify travel times, congestion, route choices, disruption effects and other performance outcomes.
Read more: Transport model
Assessing impact and response
Performance metrics
Performance metrics quantify the consequences of disruption and the resilience of the transport system.
The POESE framework captures impacts across five dimensions: physical, operational, environmental, social and economic. Between them these cover affected road links, delays, cancelled journeys, emissions, distributional impacts and economic costs.
Read more: Performance metrics
Adaptation measures
Adaptation measures are interventions intended to reduce transport-system exposure, vulnerability and disruption under climate hazards.
They include green infrastructure, grey infrastructure and soft measures. Each can be introduced through the hazard models, through transport-network modifications, or through changes to travel demand, then evaluated against a baseline scenario.
Read more: Adaptation measures
The resilience tool
The resilience tool provides an empirical assessment of how road-network performance responds to disruptive conditions, complementing the simulation-based components above.
The GLM Resilience Model estimates the sensitivity of individual Strategic Road Network links to rainfall, and projects future link-level traffic speeds under combined climate and transport-demand scenarios.
Read more: Resilience tool
Running it all
The IMP software platform
The software platform coordinates and executes the models and data-processing steps as a single integrated workflow.
The prototype orchestration system uses Apache Airflow to organise processing tasks as directed acyclic graphs. Docker, object storage, metadata storage and version control support repeatable model execution and keep track of data and model versions.
Read more: IMP orchestration