

North East England
The North East England case study applies the IMP to the Tyne and Wear region, to assess road-transport disruption and wider ripple effects under a 1-in-30-year heavy-rainfall event.
It is the most complete application of the framework, linking weather and flood-hazard modelling with transport demand, transport supply and agent-based transport simulation, and using multidimensional performance metrics to assess physical, operational, environmental, social and economic impacts.
The foundation model
Its passenger-transport modelling builds on a MATSim representation of Tyne and Wear, developed and validated for a regular working day in 2019 by Alvarez Castro (2024).
Validation
The underlying MATSim model was validated against several independent datasets:
| Dataset | Validates |
|---|---|
| National Travel Survey statistics | Travel behaviour and trip rates |
| Census travel-to-work information | Commuting patterns |
| Observed Traffic and Accident Data Unit traffic counts | Network flows |
(Alvarez Castro, 2024; Gateshead Council, 2023)
Why the validation detail matters
A disruption result is a difference between two model runs. If the baseline run does not reproduce ordinary weekday travel, the difference measures model error as much as flood impact.
Validating against three independent sources, covering behaviour, commuting and observed counts, is what makes the baseline trustworthy enough to subtract from.
How the IMP was applied
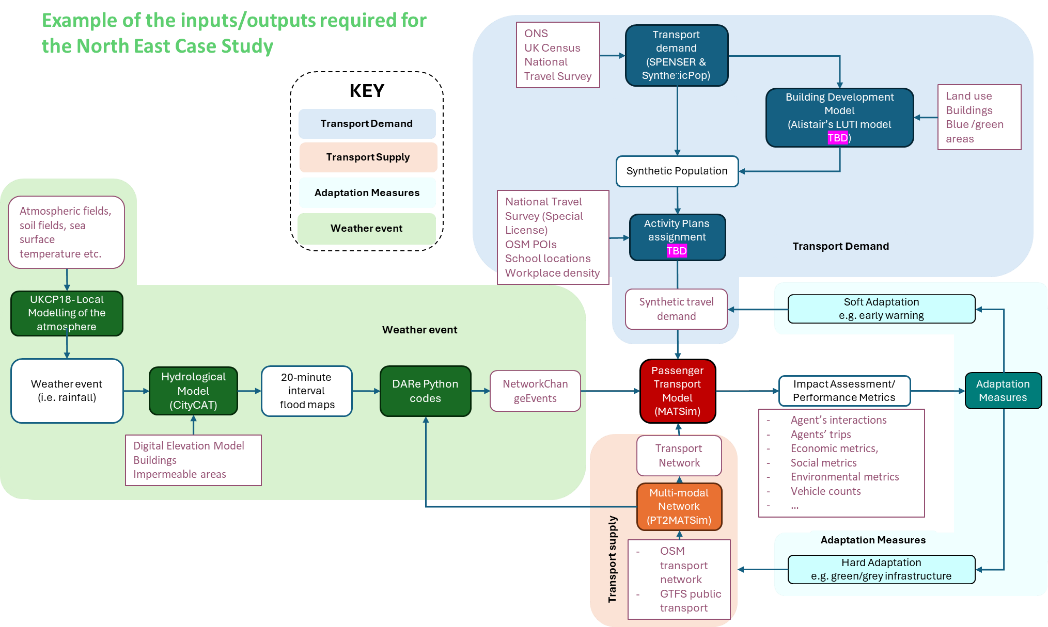
Figure 5. Inputs and outputs required for the North East case study, showing the tools used and how they connect.
The hazard pathway
Climate and weather information are used to define the rainfall event, which is simulated through the flood-hazard workflow to produce time-varying flood maps. These outputs are then processed to identify transport-network links affected by flooding.
Figure 5 names the specific chain:
| Stage | Tool or product |
|---|---|
| Atmospheric modelling | UKCP18-Local modelling of the atmosphere |
| Inputs to it | Atmospheric fields, soil fields, sea surface temperature |
| Weather event | Rainfall |
| Hydrological model | CityCAT |
| Inputs to it | Digital elevation model, buildings, impermeable areas |
| Hazard output | 20-minute interval flood maps |
| Conversion | DARe Python codes |
| Transport-readable output | NetworkChangeEvents |
NetworkChangeEvents is the coupling mechanism
This is the most useful technical detail in the figure, and it does not appear in the handbook text.
NetworkChangeEvents is MATSim's native mechanism for altering link attributes, such
as capacity or free-flow speed, at specified times during a simulation. Converting
20-minute flood maps into a sequence of these events is precisely how a hazard becomes
a transport disruption.
It also explains why the flood model's time resolution matters so much: each flood map becomes a timed change to the network, so the simulation sees the flood develop, peak and recede.
The demand pathway
In parallel, population and travel information are used to construct synthetic travel demand.
Figure 5 shows this pathway in detail:
| Stage | Tool | Data sources |
|---|---|---|
| Transport demand generation | SPENSER and SyntheticPop | ONS, UK Census, National Travel Survey |
| Land-use projection | Building Development Model | Land use, buildings, blue and green areas |
| Result | Synthetic population | |
| Activity plans | Activity plans assignment | National Travel Survey (special licence), OSM points of interest, school locations, workplace density |
| Result | Synthetic travel demand |
Two components are marked TBD in the figure
The Building Development Model and the Activity plans assignment both carry a
TBD marker in Figure 5, indicating they were not settled when the diagram was drawn.
The Building Development Model is additionally annotated informally as "Alistair's LUTI model", a land use and transport interaction model. Like the references to "David's PhD thesis" elsewhere in the handbook, this should be replaced with a proper citation.
The supply pathway
Road and public transport data provide the transport supply:
| Component | Tool | Sources |
|---|---|---|
| Transport network | OSM transport network | |
| Multi-modal network | PT2MATSim | GTFS public transport |
Simulation and assessment
Demand and supply are combined in the passenger transport model to simulate travel under baseline and disrupted conditions.
Model outputs are then used to calculate impact and performance metrics. Figure 5 lists them as:
- Agent interactions
- Agent trips
- Economic metrics
- Social metrics
- Environmental metrics
- Vehicle counts
The handbook text adds travel disruption to this list. These map onto the POESE framework.
Adaptation
Adaptation scenarios can be introduced through changes to demand or infrastructure and compared with the baseline case.
Figure 5 shows both routes, matching the categories in adaptation measures:
| Route | Example | Enters at |
|---|---|---|
| Soft adaptation | Early warning | Synthetic travel demand |
| Hard adaptation | Green or grey infrastructure | The weather event and transport supply |
Undocumented components
UDM is named but never described
The handbook's "Inputs per module" heading for this case study contains a single entry: UDM (Urban Development Model).
That acronym appears exactly once in the entire handbook, here, with no description, inputs, outputs or reference. It has no entry in any modelling chapter.
It is plausibly the same component as the Building Development Model in Figure 5, but the handbook does not say so. Both need documenting, and the relationship between them clarified.
Related reading
The POESE framework has itself been demonstrated for a 1-in-30-year heavy-rainfall event in Tyne and Wear (Bi et al., 2026), the same region and return period as this case study. See performance metrics: further reading.